Cell-level DE SNP Analsyis
Andrew Potter
2025-05-12
cell_level_DE.RmdCell-level DE SNP Analysis
Cell-level differential SNP analysis focuses on identifying differential SNP expression between cell clusters.
Find DE SNPs between cell clusters
To perform cell-level DE SNP analysis, use the findDESNPs function:
#Set up project

# Creat variantCell object (if you haven't already done so)
\dontrun{
  # Initialize a variantCell project
  project <- variantCell$new()

  # In practice, you would add samples and build the database first
  # project$addSampleData(...)
  # project$buildSNPDatabase()
  # project$setProjectIdentity("cell_type")
#Set metadata column as identity
project$setProjectIdentity("cell_type")
#find DE SNPs between cell clusters
findDESNPs = function(ident.1,
ident.2 = NULL,
donor_type = NULL,
use_normalized = TRUE,
min_expr_cells = 3,
min_alt_frac = 0.2,
logfc.threshold = 0.1,
calc_p = TRUE,
p.adjust.method = "BH",
return_all = TRUE,
pseudocount = 1,
min.p = 1e-300,
debug = FALSE,
n_cores = NULL)
}Usage example:
#find DE SNPs between Trm and all others
DE_results <- project$findDESNPs(
  ident.1        = "Trm",
  use_normalized = TRUE,
  n_cores        = 15
)
ident.1 is mandatory, while ident.2 can
optionally be used to compare to a second identity. Use the
n_cores parameter to set how many processing cores will be
used.
A dataframe will be returned with the DE SNP results.
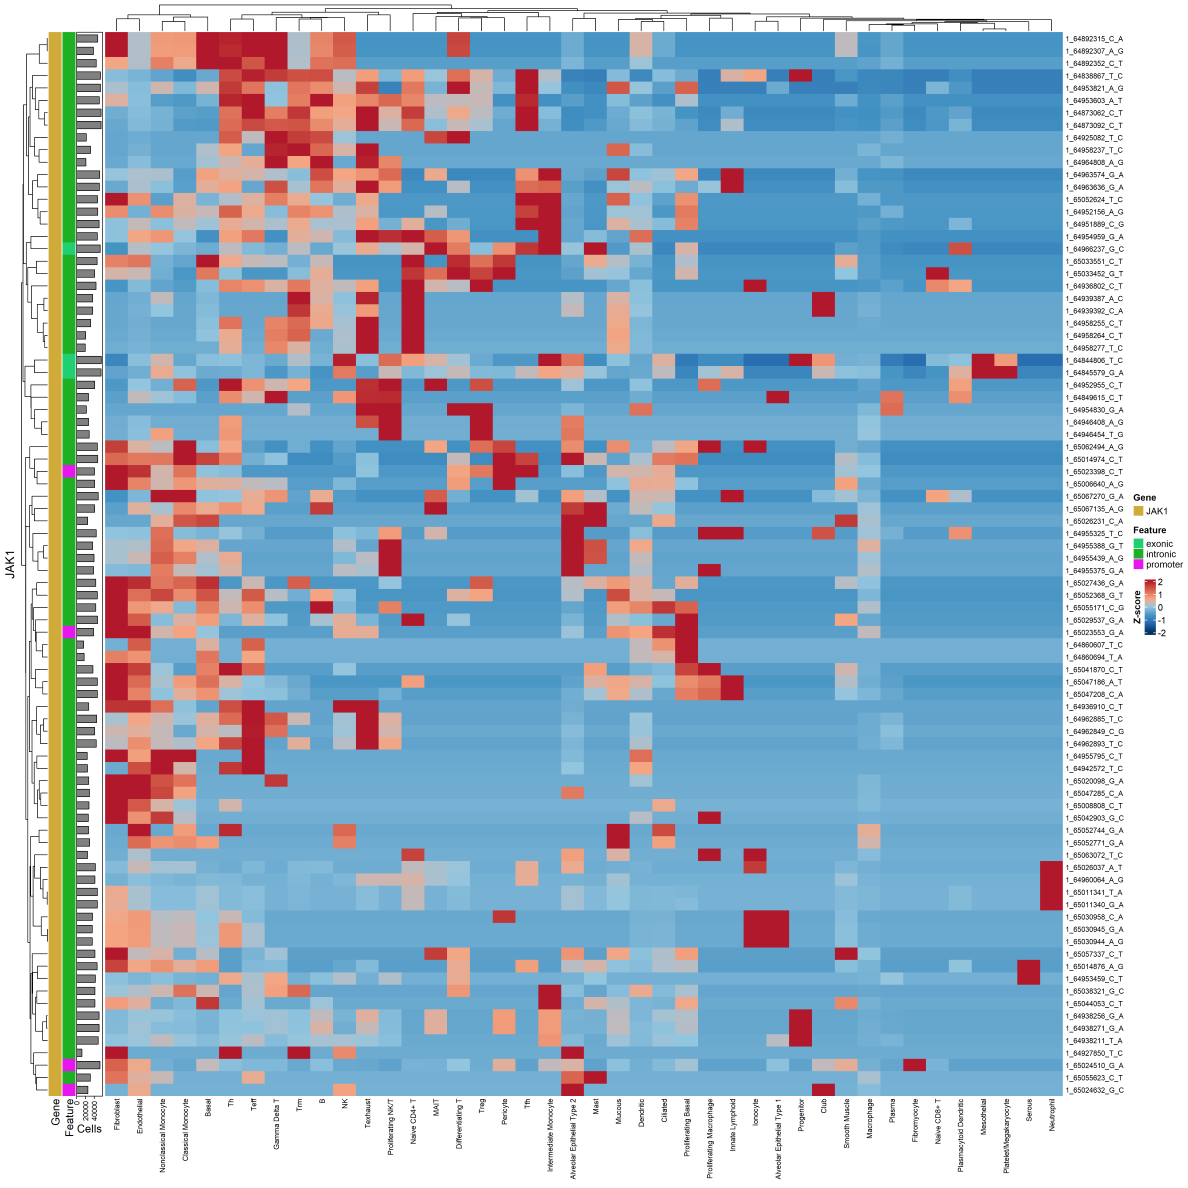
Visualizing DE SNP Expression in Cell Clusters
A heatmap can be generated illustrating DE SNP expression (requires ComplexHeatMap and circlize):
#plot SNPs in heatmap
    plotSNPHeatmap = function(
                                  genes = NULL,
                                  snp_indices = NULL,
                                  group.by,
                                  split.by = NULL,
                                  min_alt_frac = 0.2,
                                  scale_data = TRUE,
                                  max_scale = 2,
                                  cluster_rows = TRUE,
                                  cluster_cols = TRUE,
                                  show_rownames = TRUE,
                                  show_colnames = TRUE,
                                  fontsize_row = 8,
                                  fontsize_col = 8,
                                  exclude_empty = TRUE,
                                  normalize_by_cells = TRUE,
                                  data_out = FALSE
                   )
#plot JAK1 SNPs in heatmap (entire dataset) - using 'simple' idents
project$plotSNPHeatmap(
  genes        = c("JAK1"),
  group.by     = "Idents.Simple",
  min_alt_frac = 0
)